Windward Studios is now part of the Apryse family of companies. Learn More →
Windward Core is now Fluent by Apryse. Click here to experience the new and improved platform!
Transform the way your business designs & generates documents
Windward’s unique solution embeds into any application, enabling users to populate data-smart documents within the familiar landscape of Microsoft Office
Put template design where it belongs—in the hands of the document owner.
Built on the familiar capabilities of Microsoft Office so once you’re set-up, you won’t need to rely on technical expertise to create templates.
Quick to get going and quick to use
Minimal technical assistance needed to get started.
Embed Windward in your application with just 11 lines of code, then you simply upload your DOCX, XLSX, or PPTX template and you’re ready to go.
Completely custom professional documents
Customize your document format, layout, and content on-the-fly.
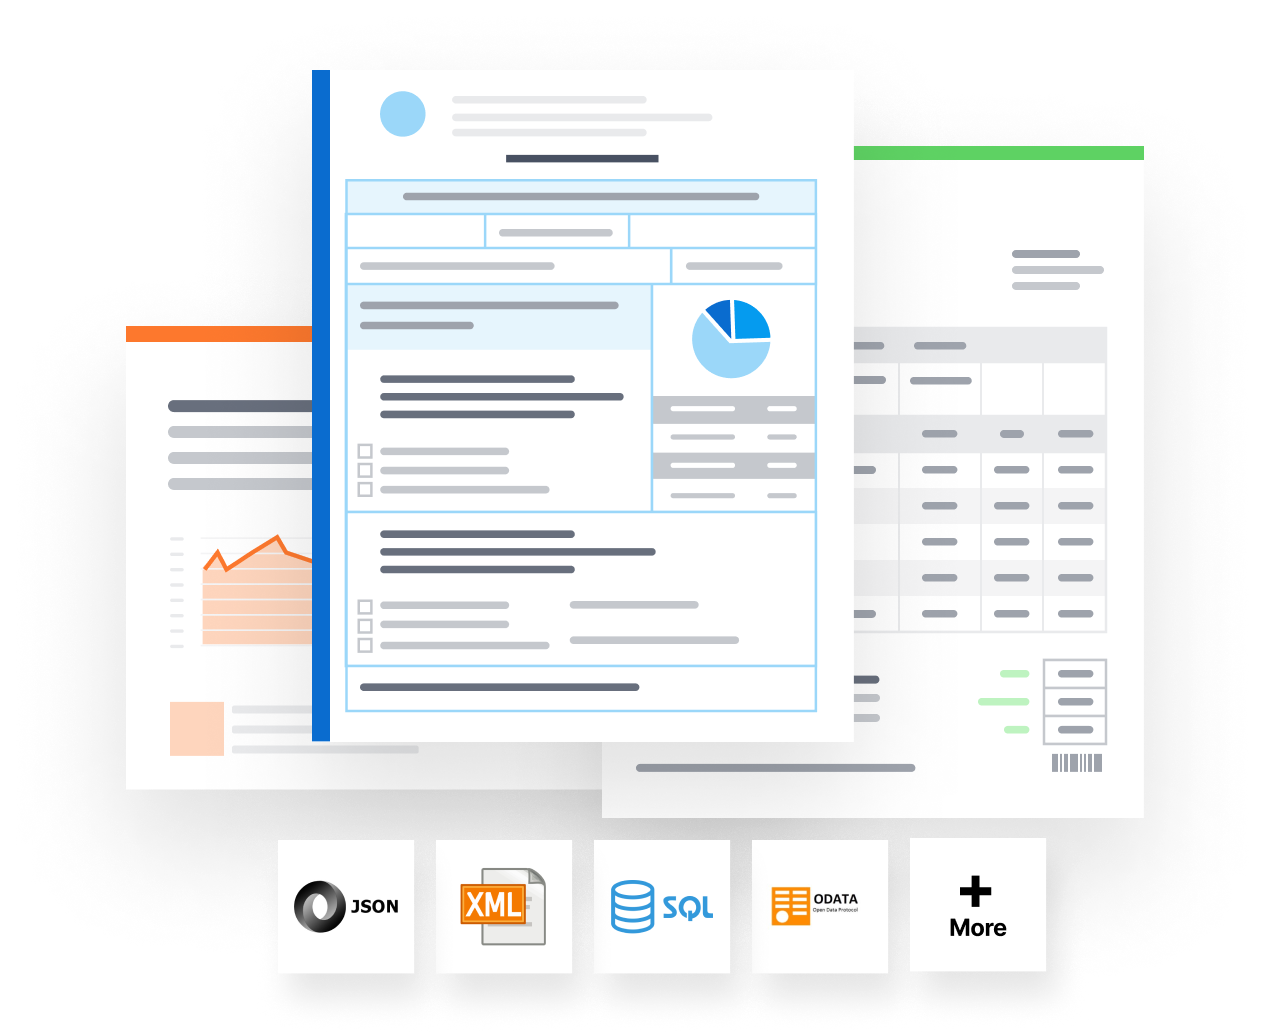
Combine data from multiple datasources and freely create documents tailored for any audience with text, logic, charts, images and more.
Every business runs on documents
Windward provides a document automation solution that is fast, easy, and removes human error, transforming the way business professionals build and maintain data-centric documents.
Who else loves Windward
Advance your work strategies, accelerate your edge.
Design with data.
Merge stunning templates with data from multiple sources.
Windward Designer means anyone in your company can design stunning templates.
Windward Core is easy to stand up quickly. It comes with our “you-can’t-beat-this” Designer tool and equally winning support. So to maximize your time value, Windward frees up your time for other needs.
Reliable and precise, it can be embedded into any application and accessed via any programming language. Change to “Imagine all of your docgen requirements met, and put to bed – quick & easy.
Enables you to add advanced document generation to your application.
Merges your data into your customizable templates to generate stunning, error-free documents.
Embeds into your application with just 11 lines of code.
There is no programming per template, once it’s set up just add templates.
We've been able to save our clients between 20 and 40 percent of their time in developing these documents. They're able to build them once, make the modifications they need to, if they have to, and they're consistent.
— Mike Horrocks, VP of Product Management at Baker Hill